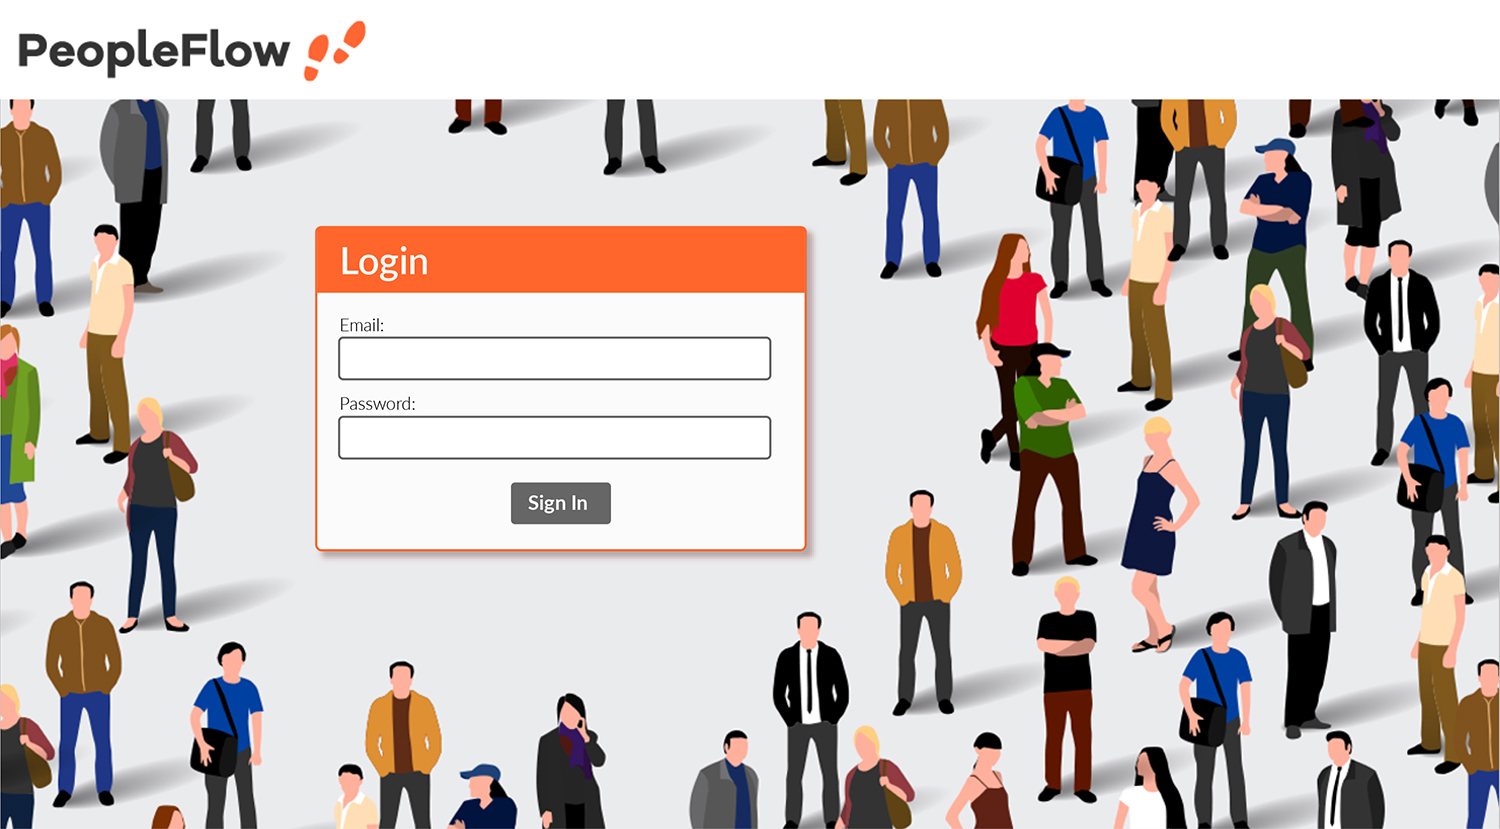
Login Page
The site uses CSS to render scalable full-page designs, and is resposnsive for tablets and other devices.
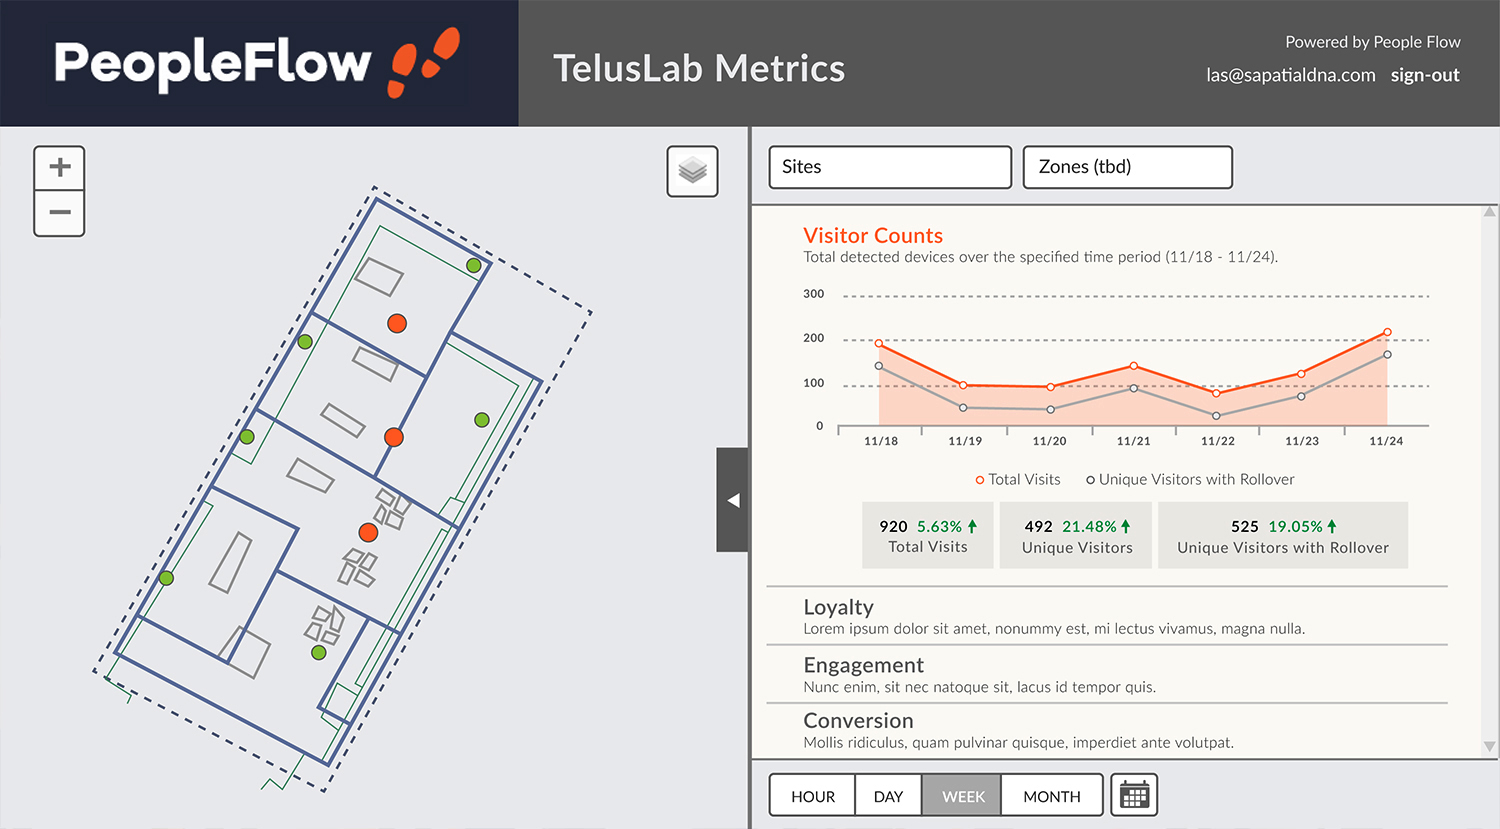
Visitor Counts
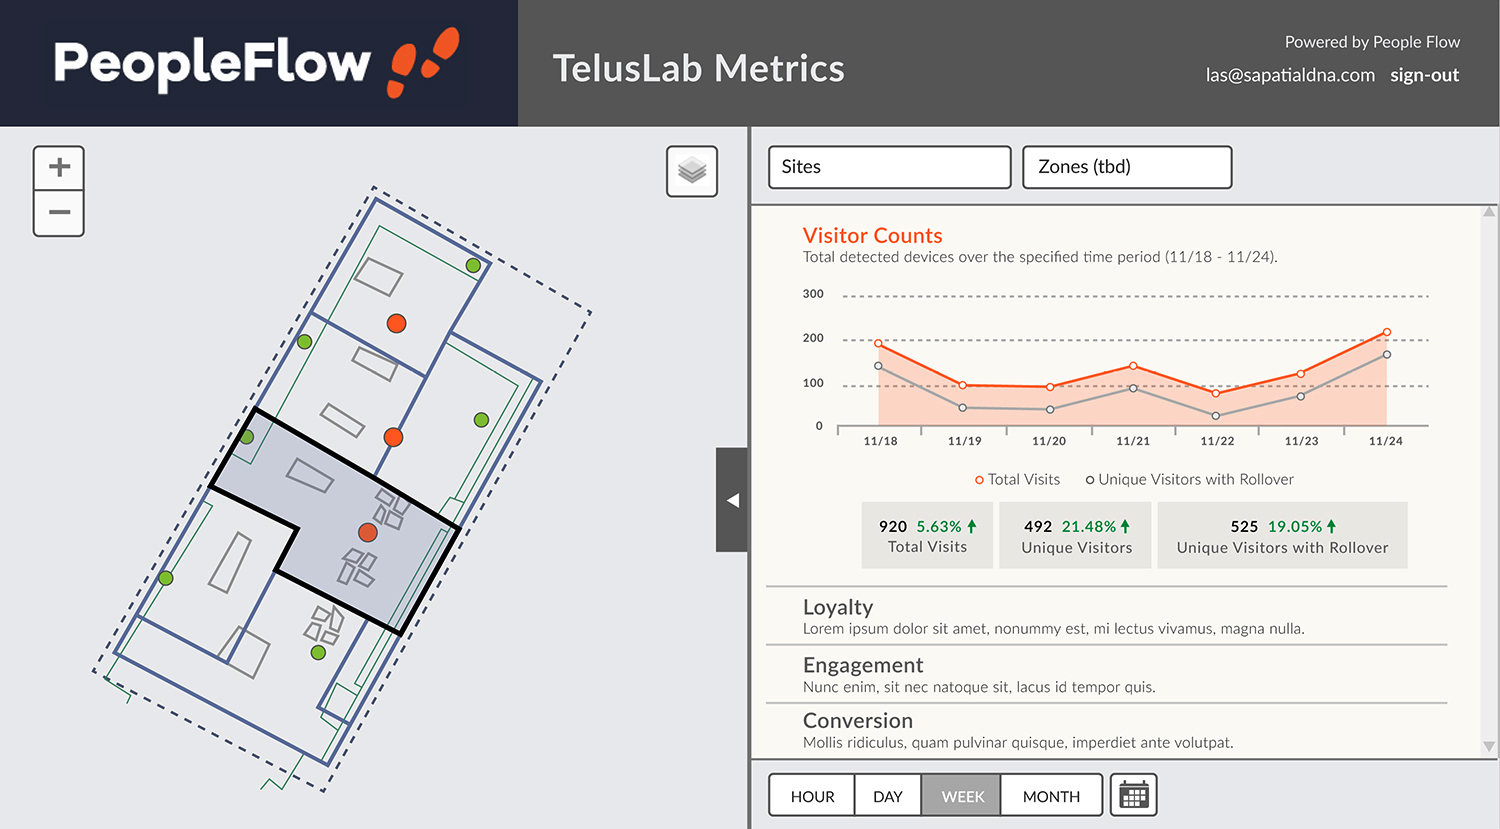
On the right are a series of charts. On the left, a site map. The charts available for selection are customizable
to clients' specific needs.
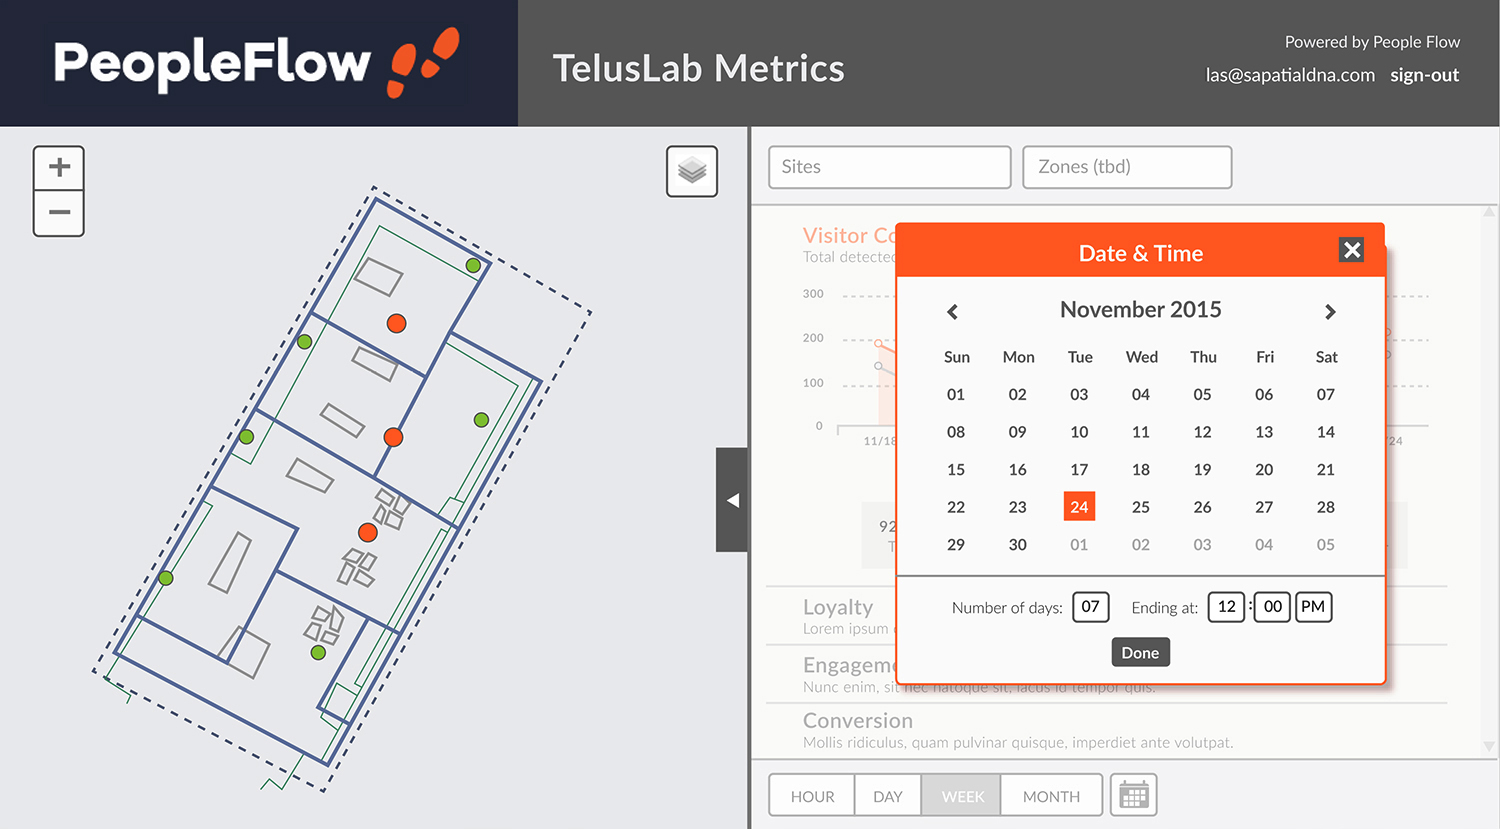
Date & Time Modal
Users can specify the time frame for the charts they are viewing.
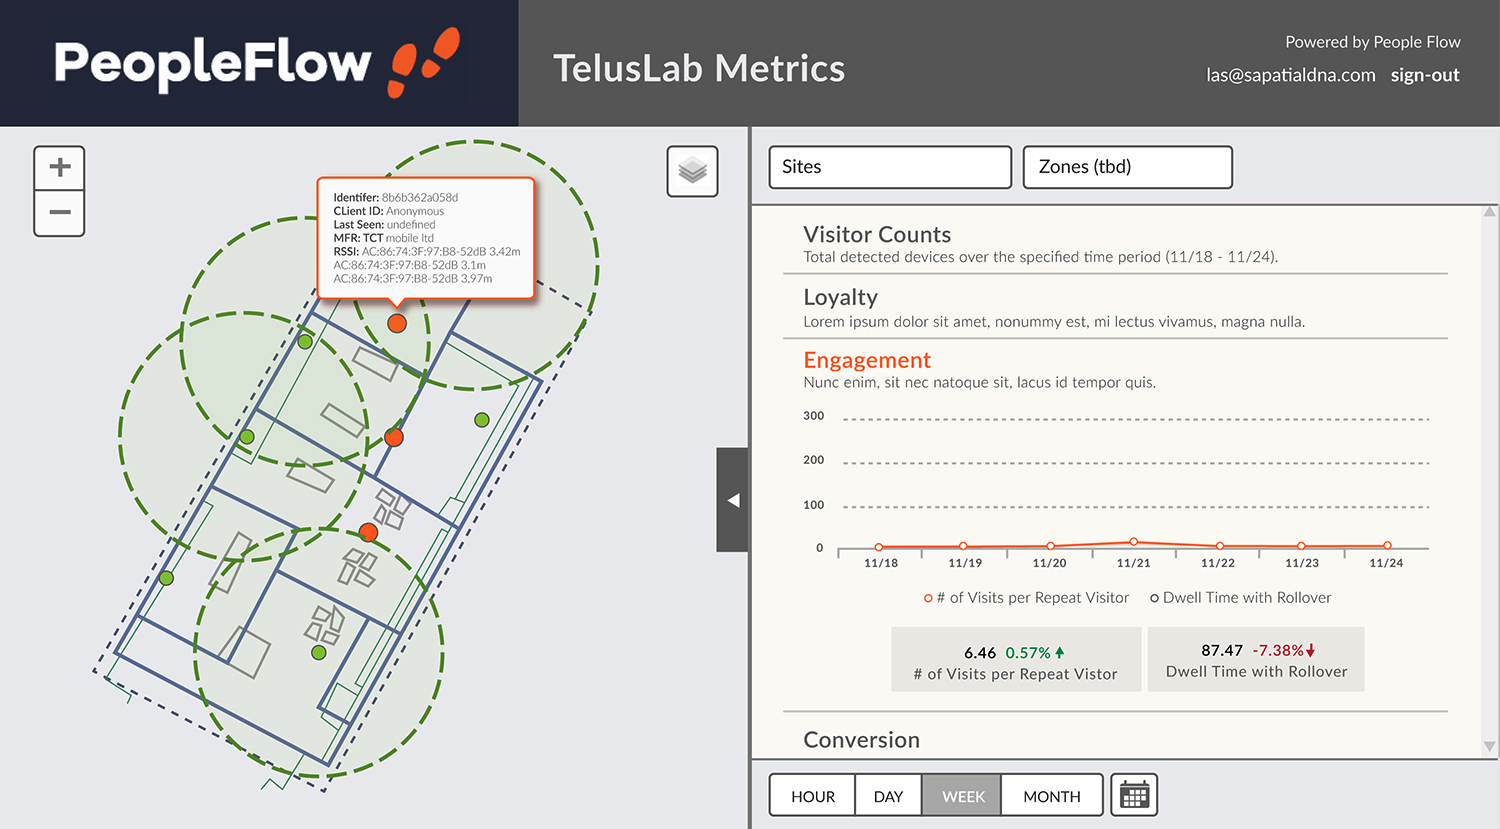
Distance Circles & Identifier Details
Select a device to show its details and relation to on-line routers. The orange dots represent individual
IDs, while the green dots represent routers. It's important to note the every ID is given a new and unique
identifier so that repeat visits can be tracked without comprimising a person's privacy.
Zone Selection
Select any zone on the map to filter the charts by a specified area.
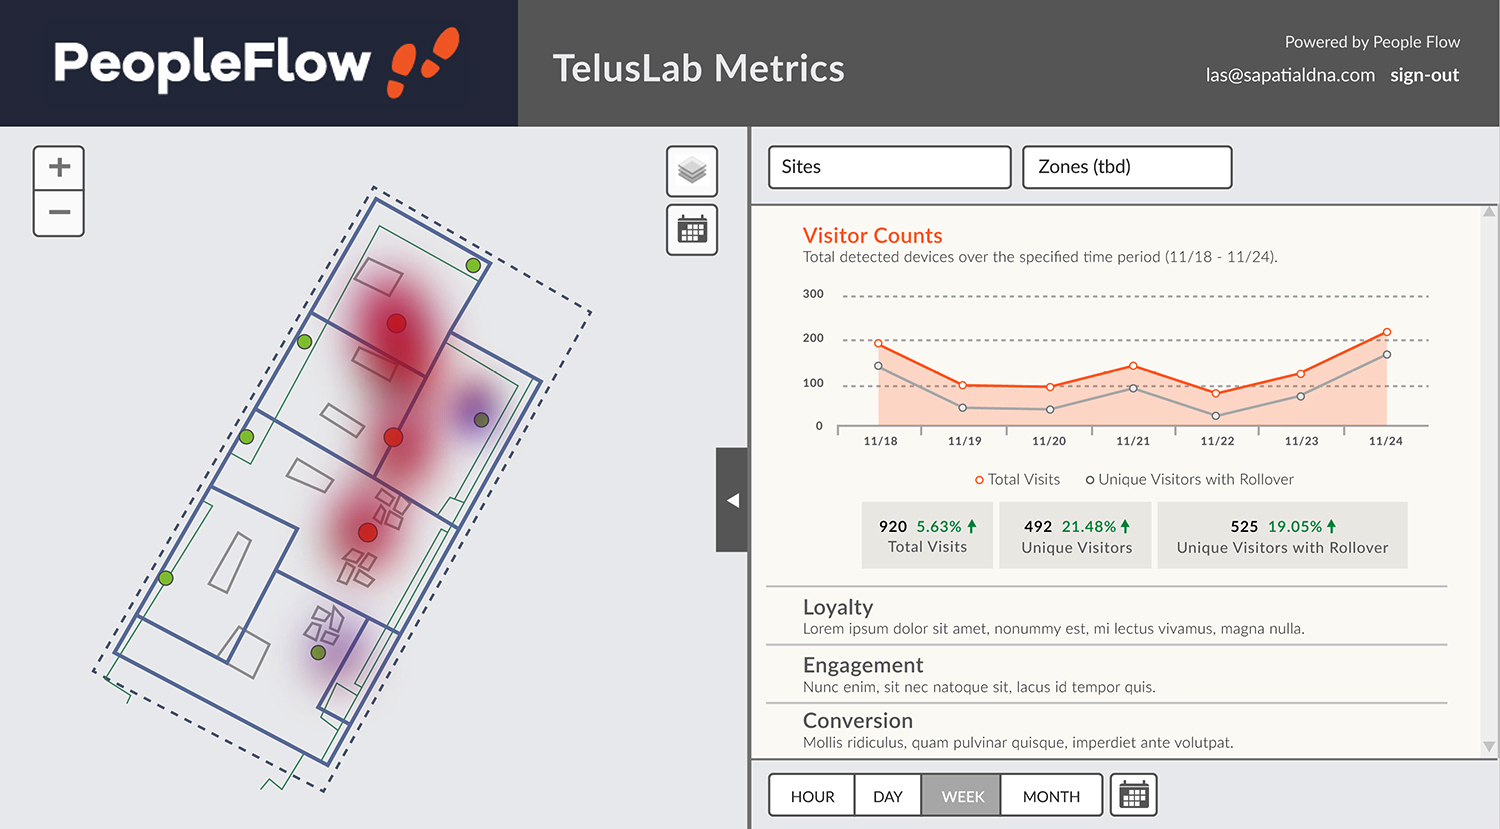
Heat Map
Heat sensors have been added to the application to ensure accuracy.
